New BigQuery UI features help you work faster
Since announcing our new interface back in July, our goal has been to make it easier for BigQuery users and their teams to uncover insights and share them with teammates and colleagues. Whether you’re a veteran or brand new to BigQuery, we wanted to highlight some of the major improvements we’ve made to the interface in the past five months. Some of this functionality was previously available in the classic UI, while other elements are totally new. Let’s take a closer look.
Collaboration features
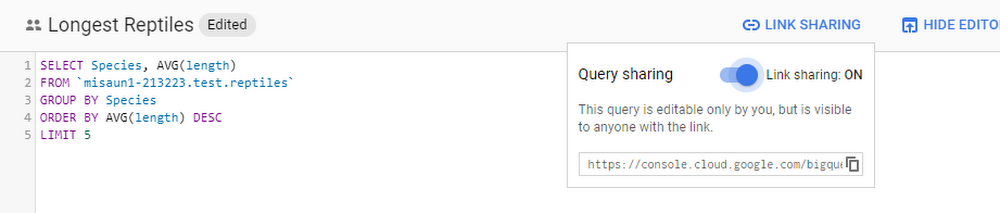
Recently we’ve released several features designed to enable analysts to easily collaborate. One of the most important additions is the ability to share queries. When you’re viewing one of your saved queries, just click the Link Sharing button above the editor and turn on link sharing to let others see your query. They’ll see any updates you make to the query too, so there’s no need to paste new versions into email.
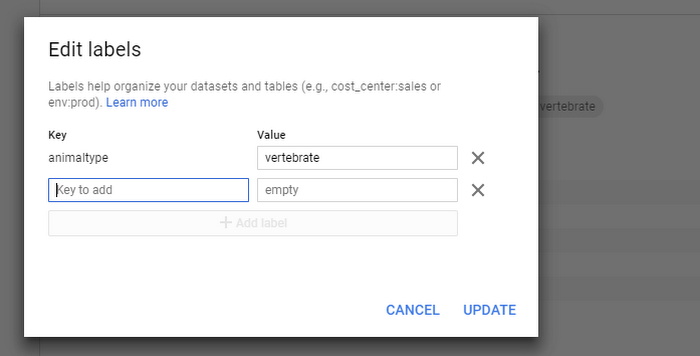
You can now also add metadata to your BigQuery resources. You can add and edit descriptions for your datasets or tables, making it easier for you and your team members to understand them. You can also create custom labels that can consist of any keys and values you choose, which can serve your team as keywords to search your datasets and tables. Click the pencil icons on the Details pages for a dataset or table to edit the metadata.
You can now edit individual column descriptions through the UI: in the Schema view for a table, click the Edit Schema button to edit descriptions for existing fields or add new ones.
Public datasets
The Google Cloud Public Dataset Program gives you access to more than 100 valuable sources of data—from census data to Bitcoin transactions to human genomes—all at BigQuery’s standard analysis pricing. Now you can include these datasets in your BigQuery queries to find your own insights or join them with your own data. Just choose the Add Data option in the Resources section and select Explore public datasets to visit the marketplace.
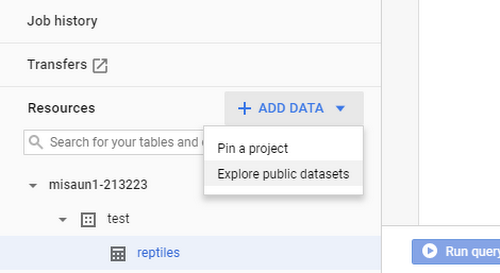
Browse the marketplace for the dataset that you want, then select View Dataset to see and query it in BigQuery.
Sorting and filtering queries
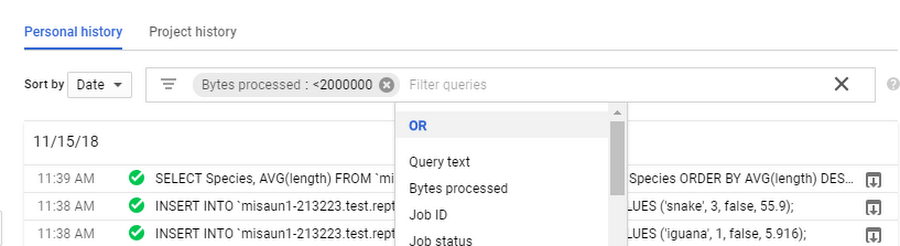
You’ve told us that it can be hard to find a specific query of interest in a lengthy query history. As such, sorting and filtering your personal and project query history have been highly-requested features. Now you can do both. Sort by the query’s date, duration, duration/MB, input bytes, slot time, or slot time/MB. Filter by the query text, bytes processed, job ID, job status, user email, and the start and end time. You can also combine filtering conditions logically to create more complex searches.
And beyond
The features above are just a few of the items we’ve been working on. We’ve also made lots of updates to improve performance, security, and reliability. For example, when you have many columns in your table, the results view and table previews now load 5-10 times faster when you first view them. For easy creation of secure tables, you can now also use the UI to create tables with your own managed encryption keys (learn more in our CMEK documentation). You’ll also notice a variety of small visual improvements like better text-wrapping and getting-started messages for anyone who hasn’t run queries or added datasets yet. And of course we’ve fixed many bugs—thank you for helping us by reporting them!
We hope you find the interface for BigQuery useful. We’re hard at work on new features and we look forward to sharing more soon. In the meantime, please keep sending us your feedback by selecting the Send Feedback option at the top right of the Google Console while you’re using BigQuery.


BigQuery has become a useful platform for analysts who need to explore large datasets and turn raw information into actionable insights. The improvements described here make the interface more collaborative by allowing teams to share queries, document datasets and tables, and organize resources with meaningful metadata. These capabilities can make analytical workflows easier to manage, especially when several people are working with the same data.
ReplyDeleteThe availability of public datasets also creates opportunities to practice working with large-scale information without needing to build every dataset from scratch. Analysts can combine public sources with their own data and investigate relationships using SQL-based analysis, making Big Data Projects a relevant area for exploring similar data-intensive use cases.
Another valuable aspect is the emphasis on collaboration and documentation. Dataset descriptions, column metadata, labels, and shared queries can help teams understand how information is structured and reduce confusion when analytical projects grow in complexity. These practices are closely connected with Data Analysis Training in India, where organizing, querying, and interpreting datasets are important parts of the analytical workflow.
ReplyDeleteThe combination of public datasets, query sharing, and improved resource metadata makes the BigQuery interface more useful for exploratory work and team-based analysis. Once useful patterns have been discovered, presenting those findings clearly becomes another important step, which is where Data Visualization Training in India can complement the analytical process.
ReplyDelete